
search-engine-optimisation18/05/2026
How competitors steal your customers early
How Australian Competitors Steal Your Customers Before You Know They Exist Most businesses lose customers before those prospects ever visit their websit...
Read article
Stay informed about the latest SEO trends, AI search optimization, and strategies to help your business rank higher and grow faster.
How Australian Competitors Steal Your Customers Before You Know They Exist Most businesses lose customers before those prospects ever visit their websit...

The Truth About SEO Timelines: What Australian Businesses Should Expect You want to know when you'll rank. Your boss wants to know when the investment p...

The Approval Bottleneck Killing Your Campaign Momentum You've built a campaign that could actually work. The timing's right, the creative's sharp, and t...

The Cost of Winging It: Why Tactics Without Strategy Fail You're busy. Genuinely busy. Your calendar is full, your inbox demands attention, and you're t...

Why Legacy Businesses Get Disrupted (Despite Bigger Budgets) You have more money than your competitors. More staff. More customers. Better brand recogni...

The Honest Timeline: When Australian Businesses See Results from Organic Search How long until we see results from SEO? It's the first question every bu...

The Retention Blindspot Costing Australian Businesses 40% of Revenue You're losing money you've already earned. Not through bad products or poor service...

Why 73% of Marketing Campaigns Launch Late (And How to Fix It) Seventy-three per cent of marketing campaigns miss their launch date. That's not a planni...

The Productivity Paradox: Why More Tools Mean Less Output Your marketing team has access to more software than ever before. Project management platforms...

How Marketing Silos Sabotage Campaign Performance Marketing silos aren't a personality clash. They're a workflow problem that shows up when teams can't ...

How Your Competitors Own Google (While You Don't) You've searched for your own services. You've seen the same three competitors appear everywhere. Posit...

What to Ask Before Signing with a Marketing Agency Hiring the wrong marketing agency doesn't just waste money. It burns time, damages momentum, and ofte...

A Step-by-Step Guide to Scaling Paid Advertising Profitably Most marketers burn budgets when they try to scale. They see a campaign performing well, cra...

Why Your Ad Budget Disappears (Without Sales to Show) You log into your ad dashboard. The number stares back at you: $4,200 spent this month. The clicks...

What Invisible Websites Really Cost Australian Businesses A Melbourne-based software company spent $48,000 on content and SEO in twelve months. Traffic ...
Why Australian Business Websites Get Zero Visitors: The SEO Reality Check Your website is live. It looks professional. You've got your services listed, ...

Voice search is changing how Australians find businesses online. Here is what that means for your SEO and how to adapt before your competitors do.

Learn why defining an entity home with schema markup is vital for Sydney SEO optimisation helping your business boost visibility.
Learn why topic-first SEO beats keyword stuffing. Build authority align with user intent and future-proof your rankings.

Unlock SEO for business growth with free Google tools. Increase traffic and grow visibility without costly subscriptions.

Complete SEO checklist to ensure your business website is optimized for search engines and ready to rank.
Discover how AI-powered keyword research services outperform traditional tools with deeper insights and faster analysis.

AI's changing SEO! Learn how AI algorithms like RankBrain & BERT impact your website's search engine visibility.

Wondering how fast you should respond to Google Reviews? This guide explains why timing matters and best practices.
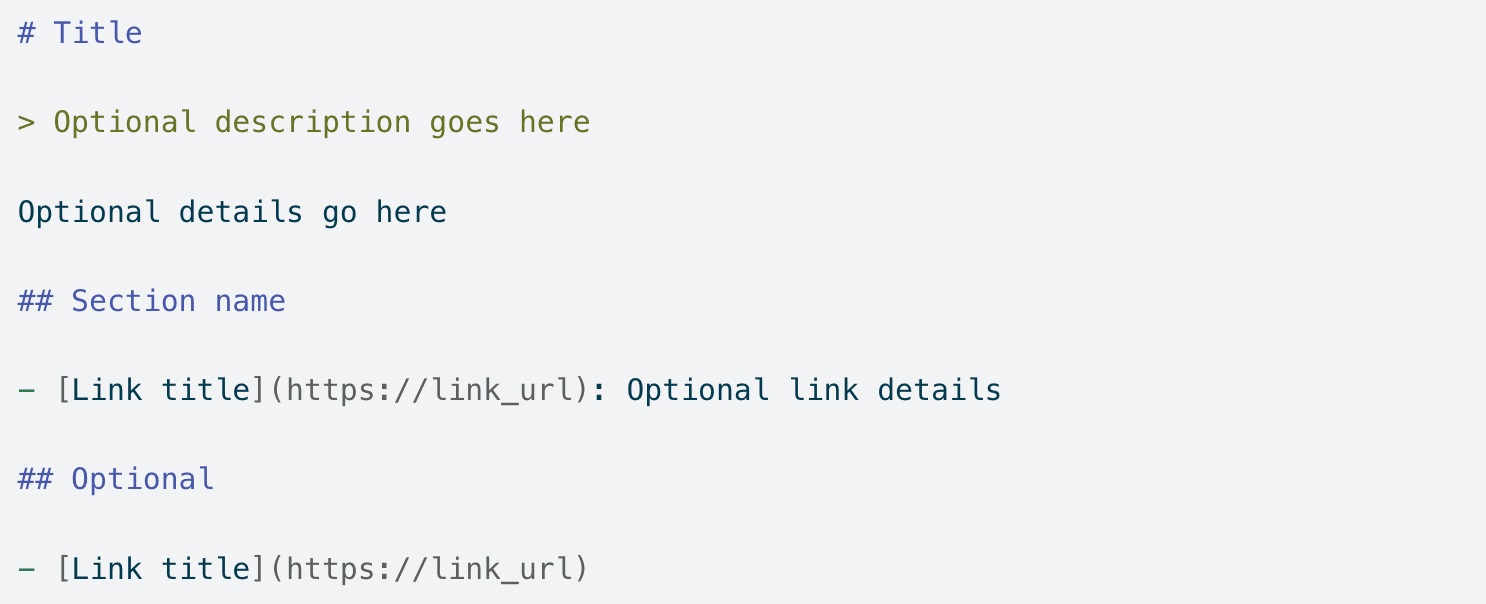
Forget robots.txt llms.txt is the new SEO power move in 2025. Discover how to boost AI visibility and drive traffic.
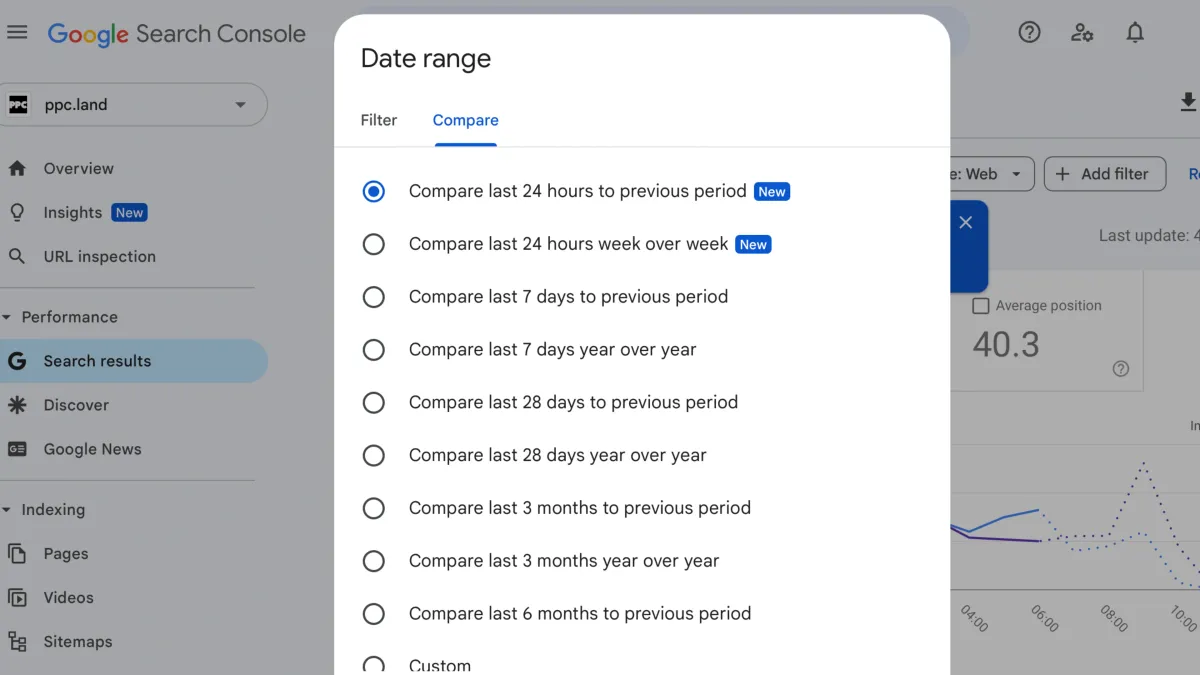
Google Search Console just added a new comparison view. See how your traffic changed hour by hour and spot issues.

Learn how to use AI writing tools while keeping your brand voice consistent. Practical steps for blending AI with human input.

A clear guide for businesses on how to appear in ChatGPT answers. Learn what matters how AI chooses content and what steps you can take.

Get featured in AI chat models like ChatGPT! Learn how to create high-quality content engage with AI communities & optimise for AI algorithms.

Optimise for AI overviews to boost your SEO! Learn how to structure content target keywords use schema markup and improve site speed.

Discover the power of Local SEO for small businesses in Sydney. Learn how optimizing your Google My Business profile can boost visibility.